Overview
In the Mevrik dashboard, a registered user will see a list of all their connected channels, their business name, and the settings for their business profile.
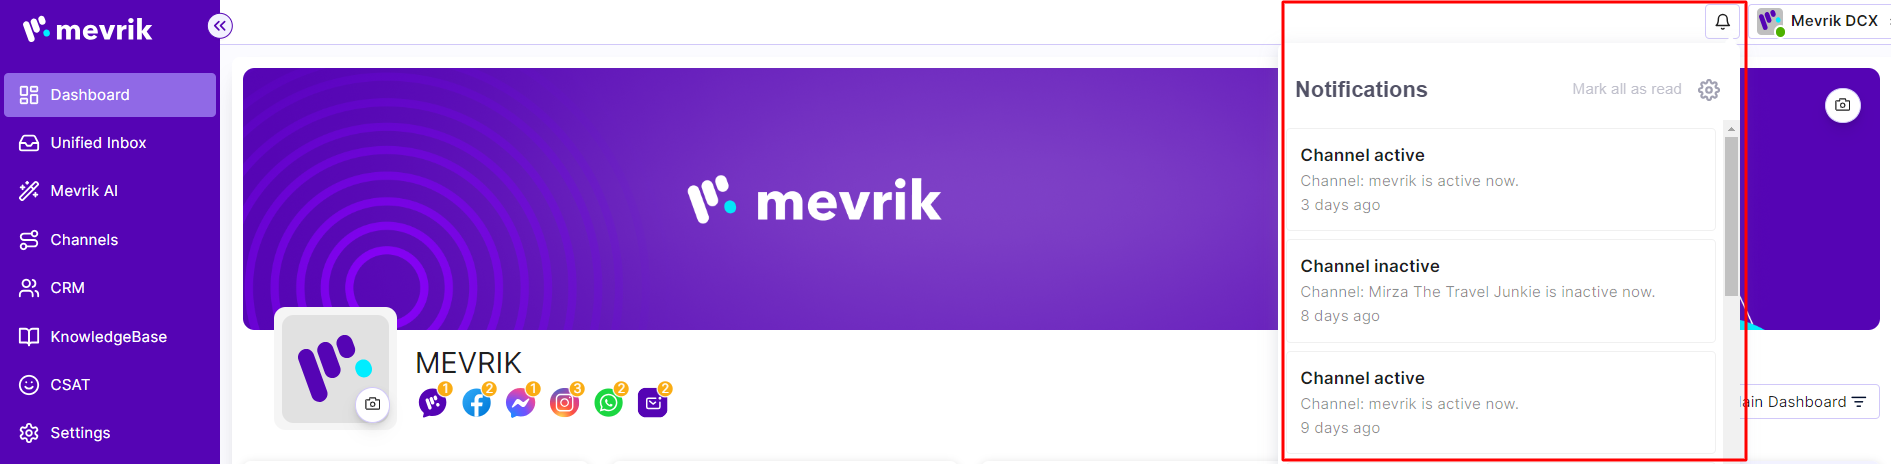
If user click on the 'Notification' icon, a pop-up notification list will appear for the user app.
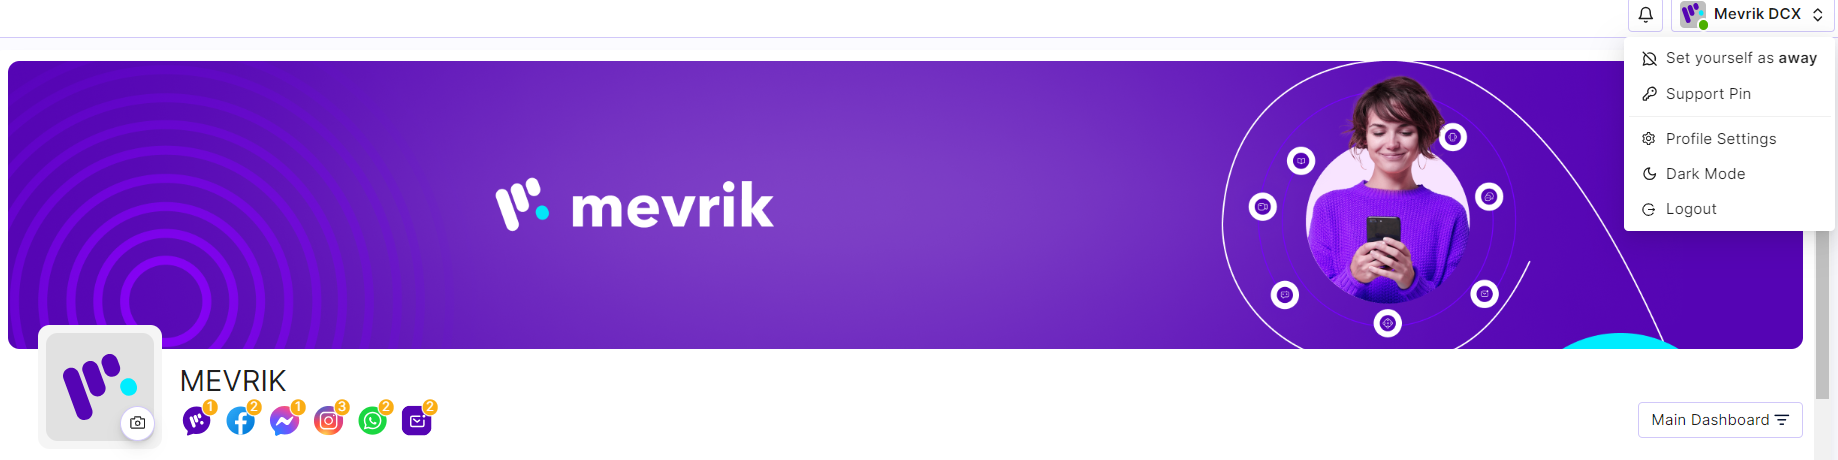
If a user hovers over their profile name, they will access a list of settings where they can toggle their status on/off, adjust their profile settings, switch to dark mode, and log out. Additionally, there is a feature called 'Support Pin' which allows customers to request support when they come to Mevrik's customer support.
After that a customer will get idea from this below information about his total business user and conversation count.
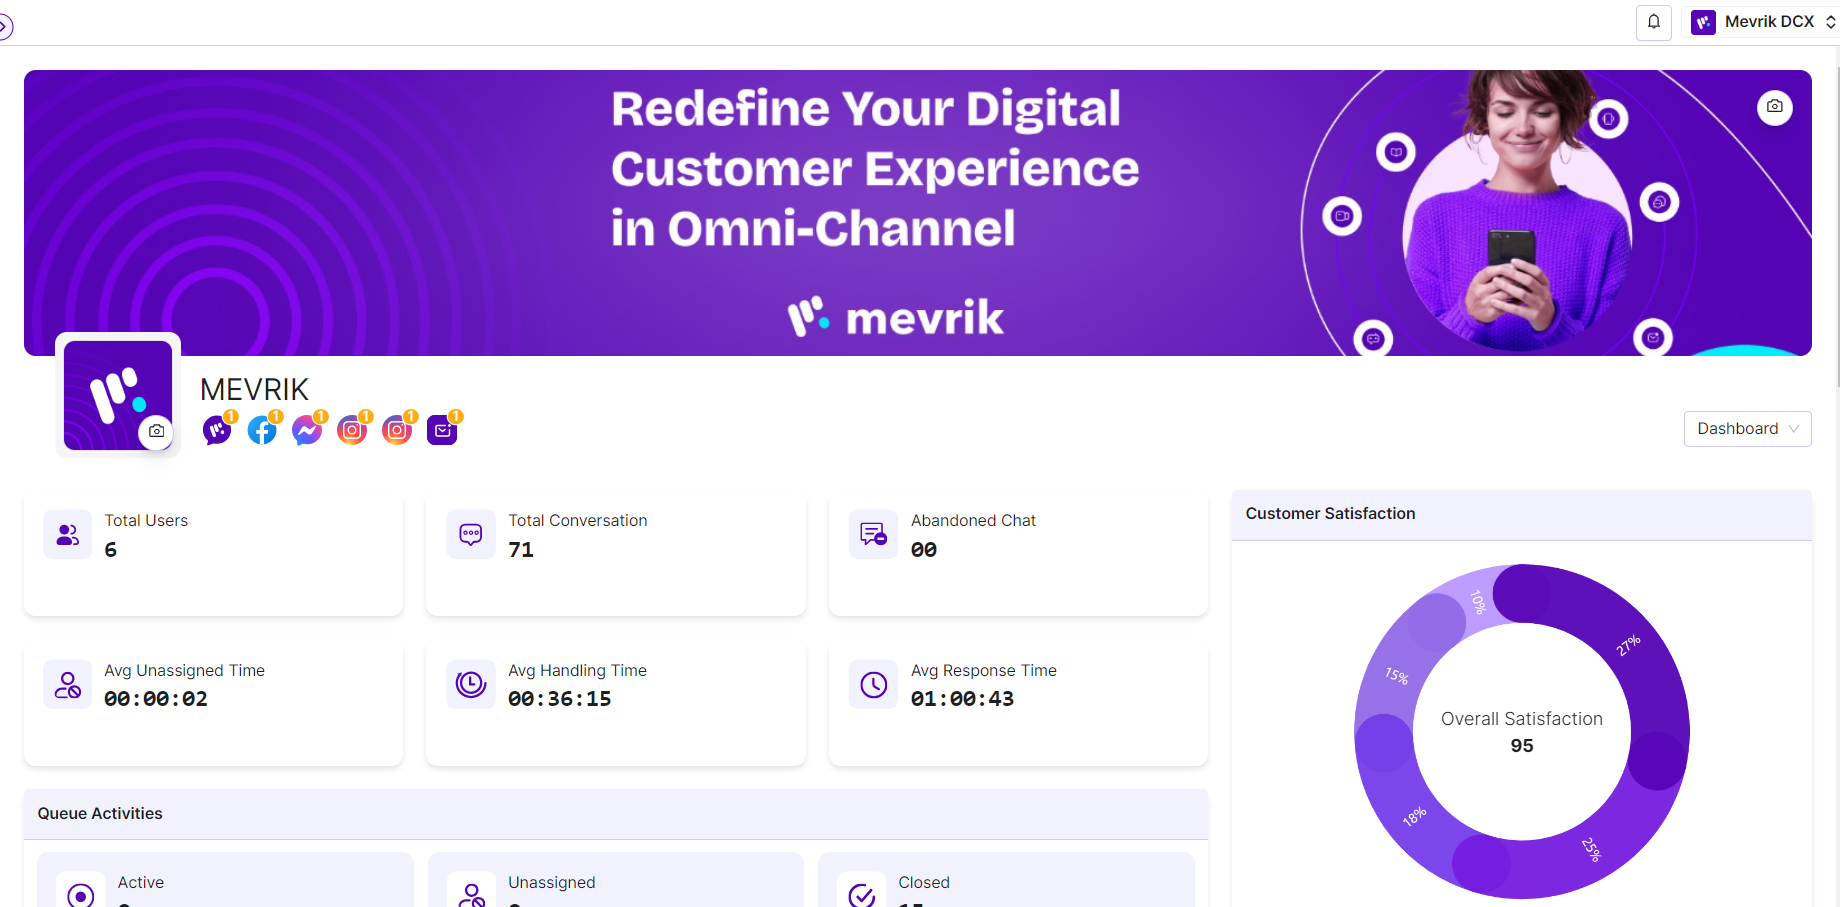
Total Users: This section will show the total number of unique users who have interacted with your Mevrik-created app through messages from different channels.
To learn more about 'Total Users', visit the following link: Click Here. From the redirected page, read about 'Total Customers' to gain further insights into the total number of users.
Total Conversation: Total number of conversation will be show for every chat that will be done by agents and customers.
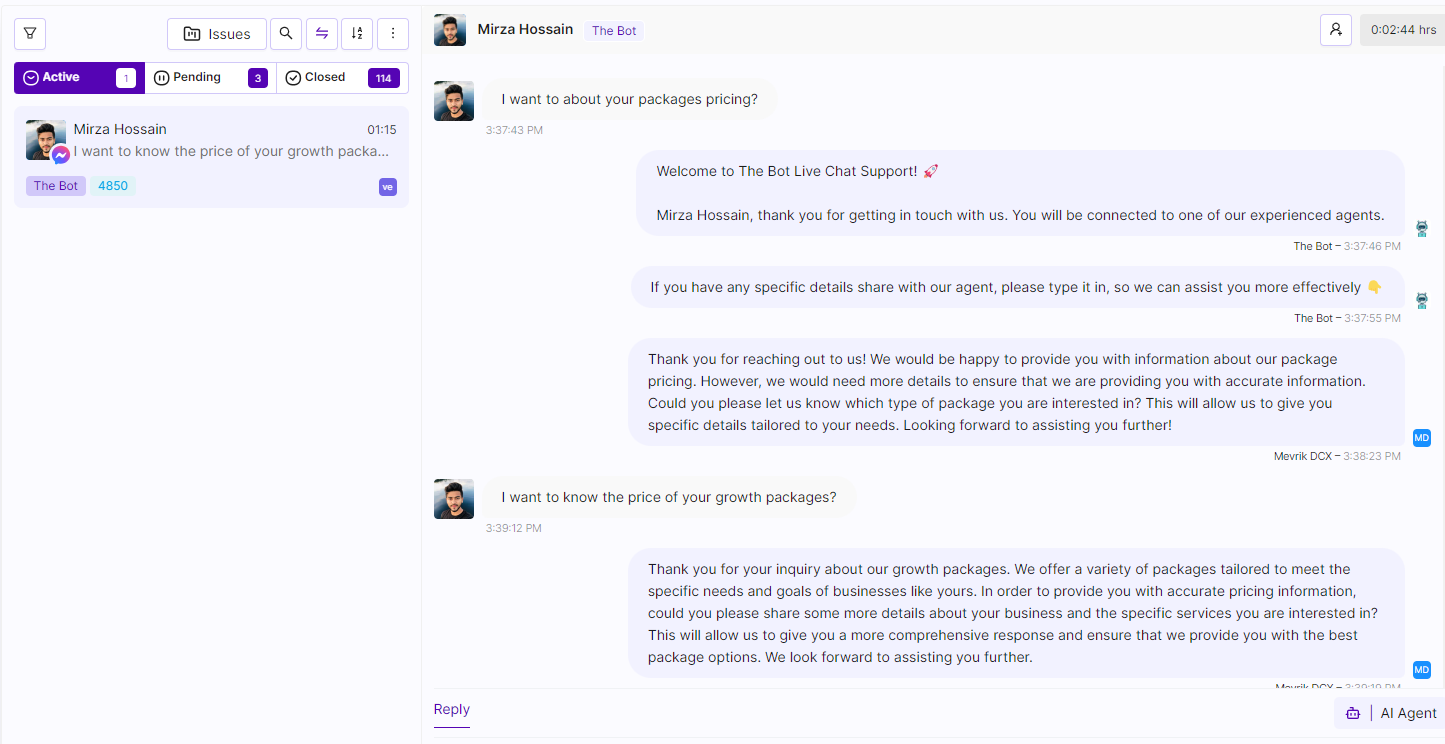
From the above conversation between an agent and a customer, we can see that there are a total of six chats. So in the dashboard, the total conversation number will be shown as six in that case. Likewise, for every chat between an agent and a customer through a ticket, a conversation number will be counted.
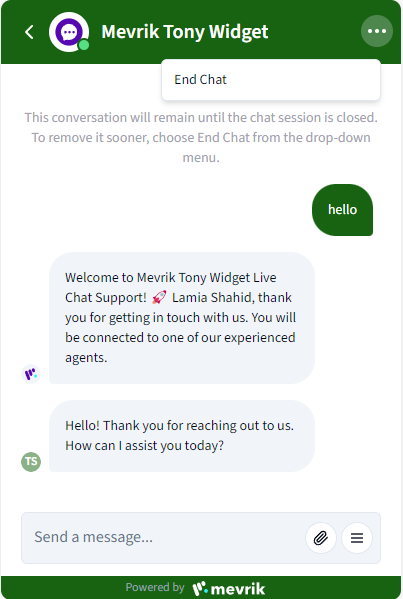
Abandoned Chat: In livechat widget, if a customer 'End' the conversation in between conversation; in this circumstance if a agent try to send message then this message will not be send to the customer inbox. This type of chat will show the number of abandoned chat.
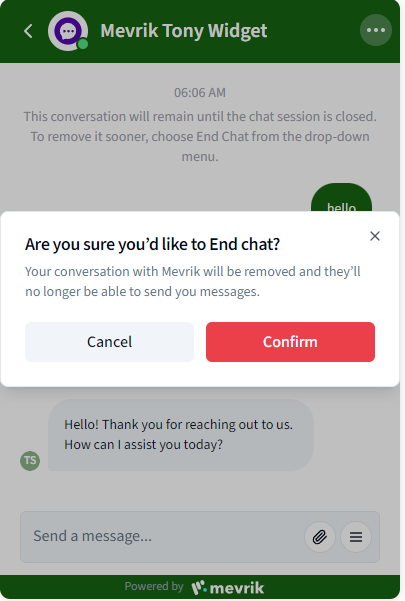
From these above pictures, it is showing that a customer is ending a chat.
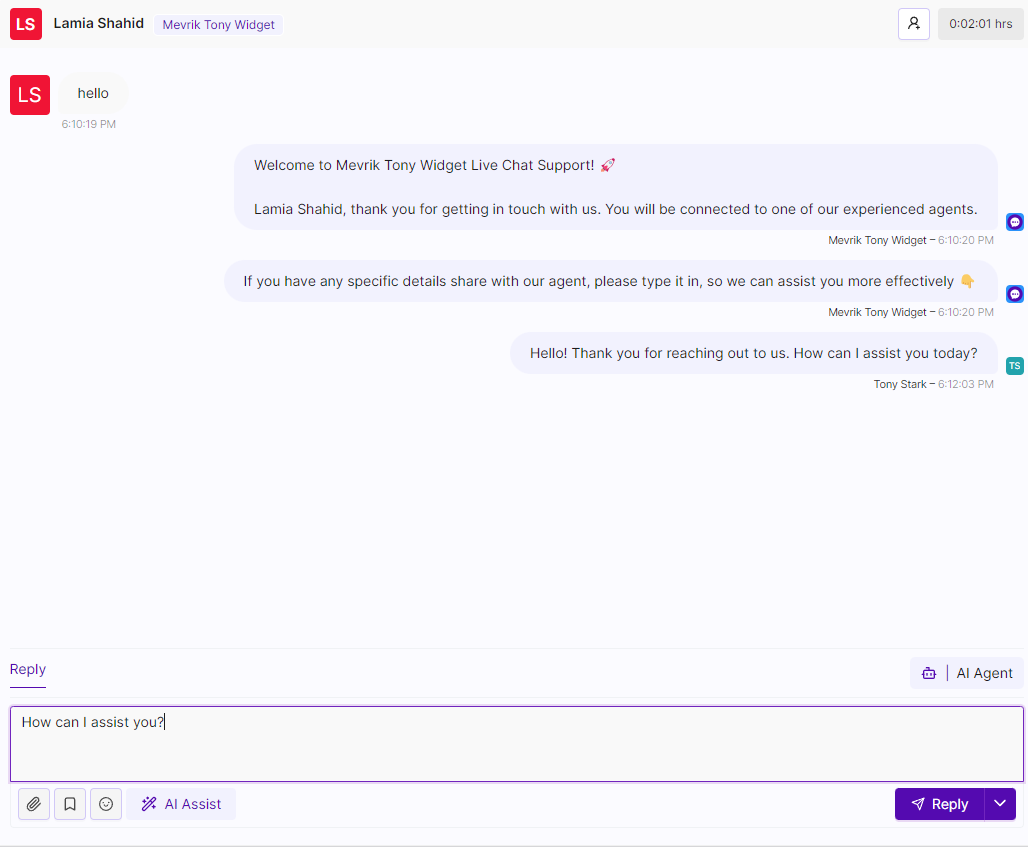
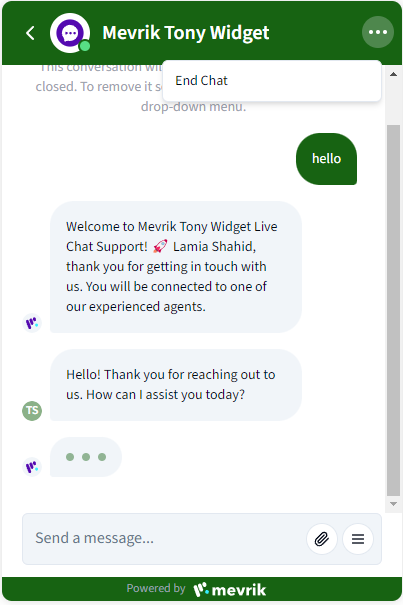
From these pictures, we can see that in the meantime, the agent is typing a message, which appears as a bubble in the user's window. After sending the message from the agent's side, this message will not be sent to the customer. In that case, this type of chat is called an abandoned chat.
Avg Unassigned Time: “Average Unassigned Time" will be showing the average time to the duration that tickets remain unassigned in system before being picked up or assigned to someone. For example, if a ticket comes in and sits in the queue for some time before being assigned to a support agent, the time it spends waiting in the queue would contribute to the average unassigned time.
Avg Handling Time: AHT is the total time an agent spends interacting with a customer, which comprises talking to the customer and any related tasks such as follow-up activities. It will measure the average duration taken to resolve a customer inquiry or issue from start to finish.
Avg Response Time: Average response time refers to the average time it takes for a customer service representative to respond to a customer's initial inquiry, such as a message or email.
Queue Activities: It will show the real time total number of active, unassigned, closed ticket of your business which will make in a day.
Active: The tickets that will be auto-assigned to agents or agent will accepted from the pending tab those tickets will then be found in the active tab.
Unassigned: The tickets that remain unassigned in system before being picked up or assigned to someone will be found in the pending tab.
Closed: The tickets that will be closed by agents after resolving a case will be found in the closed tab.
User Activities: It will display the status list of agents, supervisors, and admins who are active or offline and have performed login or logout activities with your Mevrik business account.
Customer Satisfaction: Mevrik Customer Feedback provides businesses with a CSAT dashboard that provides insights into customer satisfaction. In dashboard it will show by a pie chart which will show the percentage of surveys collected by your business channels from customer. You can get helpful feedback from customers at the end of a chat. The survey can be collected from different channels by asking customers to give answer of the question CSAT Rating and customer feedback. By collecting the survey your business will get an idea from which business platform your customer are most satisfied by taking service. Thus, you can improve the business platform to get more customers to increase your sales.
To learn more about 'Customer Satisfaction', visit the following link: Click Here.
Conversations by Topic: We have a feature called disposition which is collecting complaint/issues of customer. This chart will show the most complaint was done by customer in your business by which you can notice the complaint and try to improve that sector of your business. There user will get to see the created disposition "Type" name and will show the most usable disposition type in percentage.
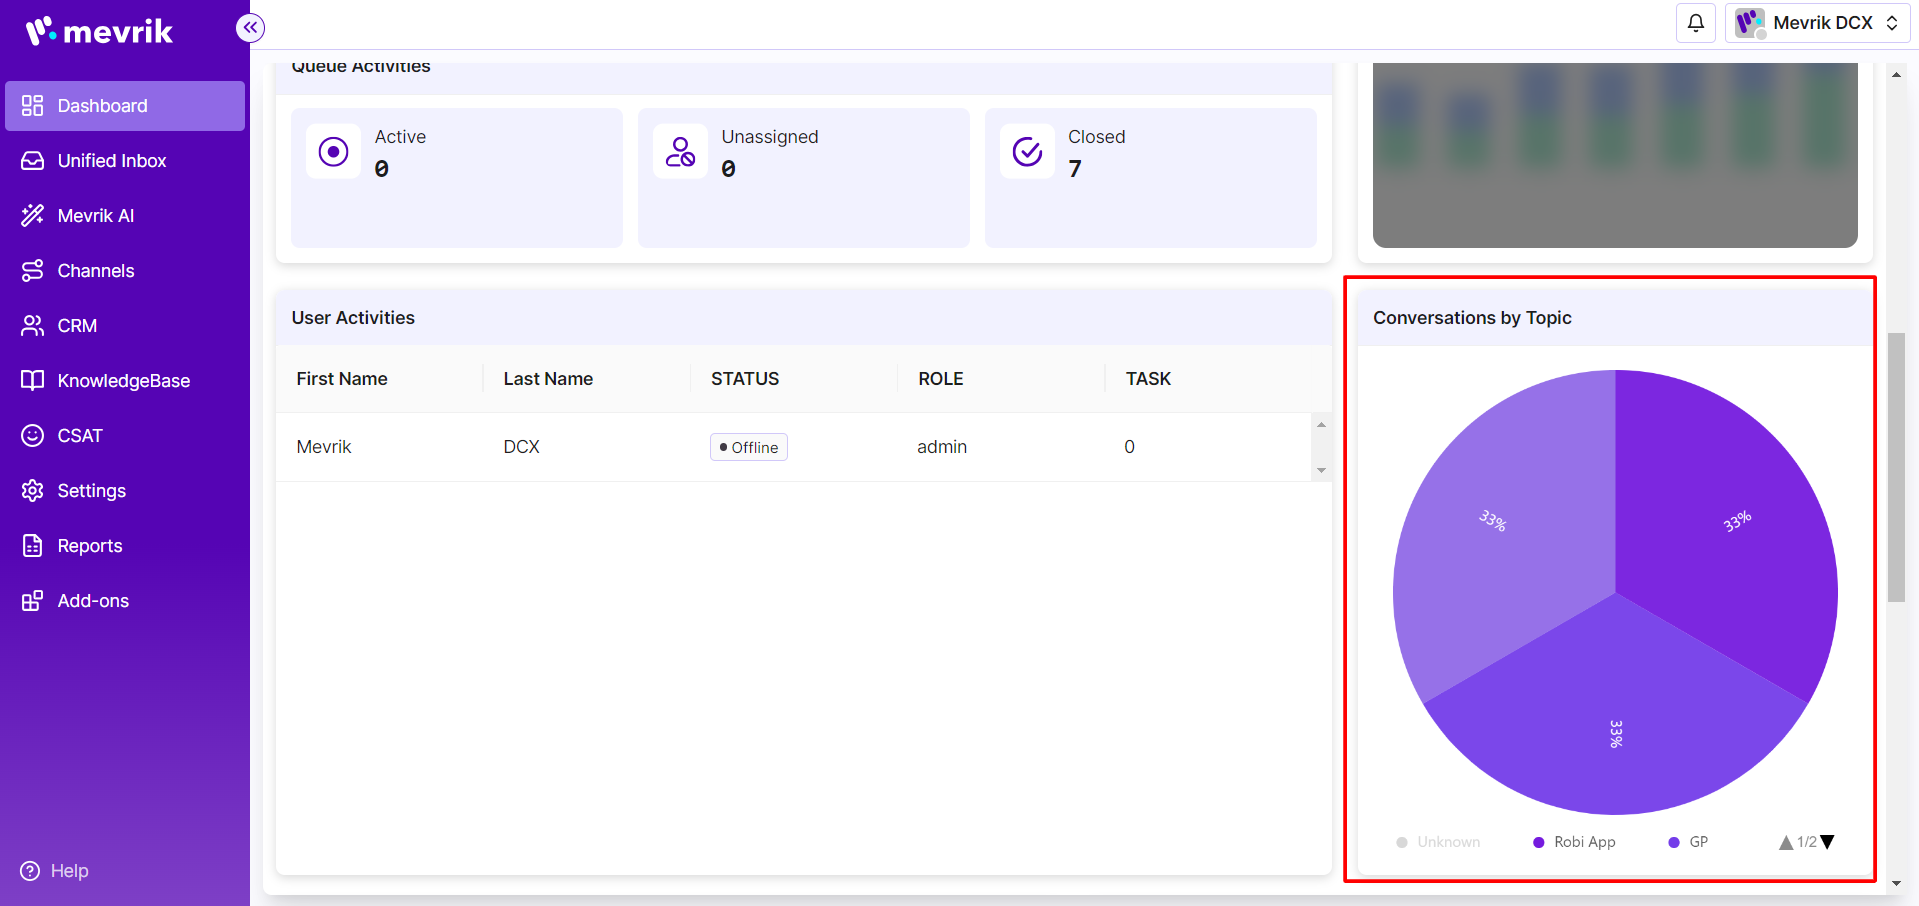
To know how to setup disposition click here: Click Here
Total Users Count: It will show the total count of users who have interacted with your Mevrik business in the last seven days' history.
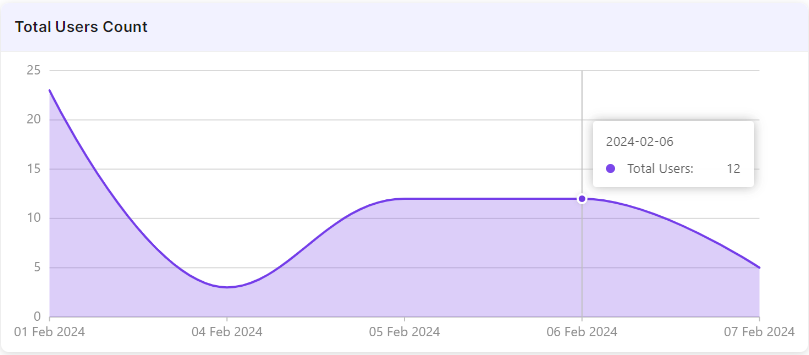
From the above graph, we can see that it's showing the data of February 6, 2024, where the total number of users is 12 who have interacted with your Mevrik business on that day.
Total Users Count by Channel: It will show the number of users who have interacted through different channels in your Mevrik-created app in the last seven days' history.
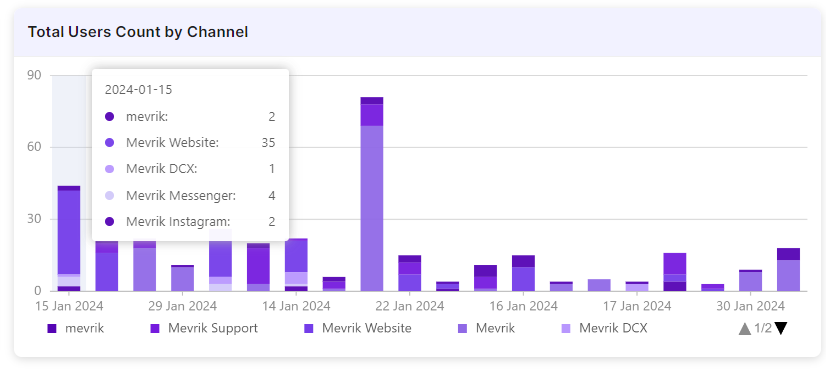
From the above graph, you can see that if I hover on January 15th, it is showing the channel names, and beside every channel, it's showing the number of users who have interacted through the channel. The total number of users is 44, and from the graph, we can see the range is between 30 and 50. By summing the number of users, you can count the total user count by channel for a date.
Total Returning Users: Total Returning Users refers to the number of unique users who interacted with your website and have come back to use it again at a later time. By understanding the behavior of returning users, businesses can tailor their strategies to enhance user experience, boost customer retention, and potentially increase revenue through repeat visits and conversions.
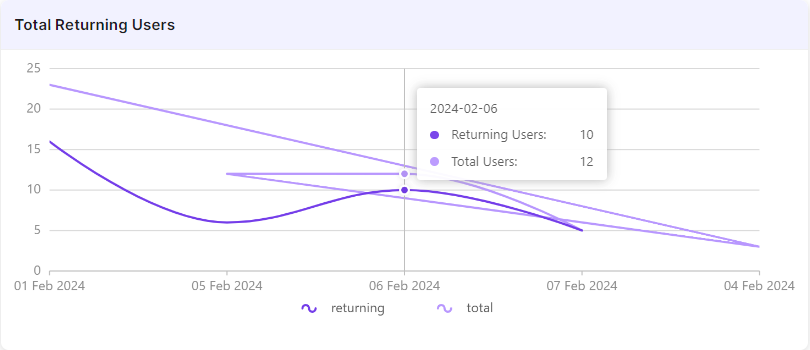
From the above graph, we can see that it's showing the data of February 6, 2024, where the total number of users is 12, and among these 12 users, the number of returning users is 10.
Messages by Incoming and Outgoing: It will show the total number of messages by incoming and outgoing who have interacted with your Mevrik business in the last seven days' history.
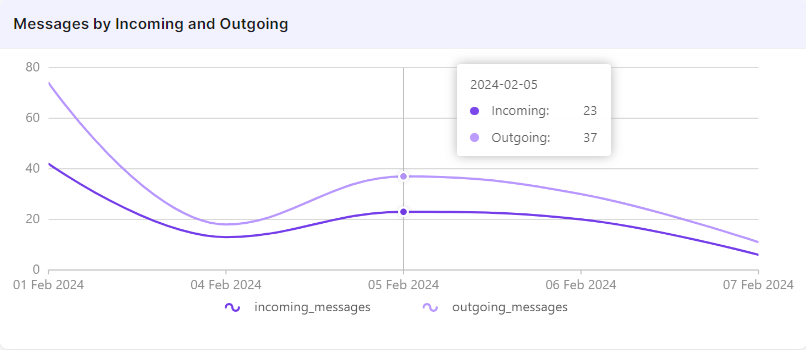
From the above graph, we can see that it's showing the data of February 5, 2024, where the total incoming messages were 23 and the total outgoing messages were 37 from users who have interacted with your Mevrik business on that day.